Il Theremino_MCA pur essendo completamente Freeware e OpenSource è un vero Multi-Channel-Analyzer da laboratorio.
Ulteriori informazioni:
– Schemi elettrici e piani di montaggio: www.theremino.com/technical/schematics
– Software: www.theremino.com/downloads/radioactivity
– Hardware, autocostruzione e kits: www.theremino.com/contacts/producers
– Immagini e Video: www.theremino.com/video-and-images
– Articolo su Elettronica Open Source: tecniche-di-condizionamento-del-segnale-spettrometria-gamma
——————-
Hardware per la Spettrometria Gamma
Il Theremino_PmtAdapter contiene un circuito di retroazione in grado di mantiene la tensione stabile anche in presenza di forti variazioni della temperatura. In questo modo la taratura rimane precisa nel tempo e le righe degli isotopi non si spostano e non si allargano.
ATTENZIONE: Per ottenere le prestazioni ottimali è necessario usare tubi PMT cablati come indicato nel file PmtAdapters.pdf – I tubi PMT a bassa impedenza (con resistori da 1 mega o addirittura da 560k) non possono funzionare con questi adapters. Per utilizzarli occorrerebbe sostituire i loro resistori come da noi indicato.
Questo adattatore può essere usato con il ben noto software freeware PRA (ringraziamo Marek Dolleiser per aver aperto la strada a questo genere di analisi, il suo software PRA è un riferimento da molti anni e ci ha aiutato molto) ma solo con il Theremino_MCA si possono fare operazioni di filtraggio e di cancellazione del fondo utilissime per ottenere il massimo di informazioni in tempi ragionevoli.
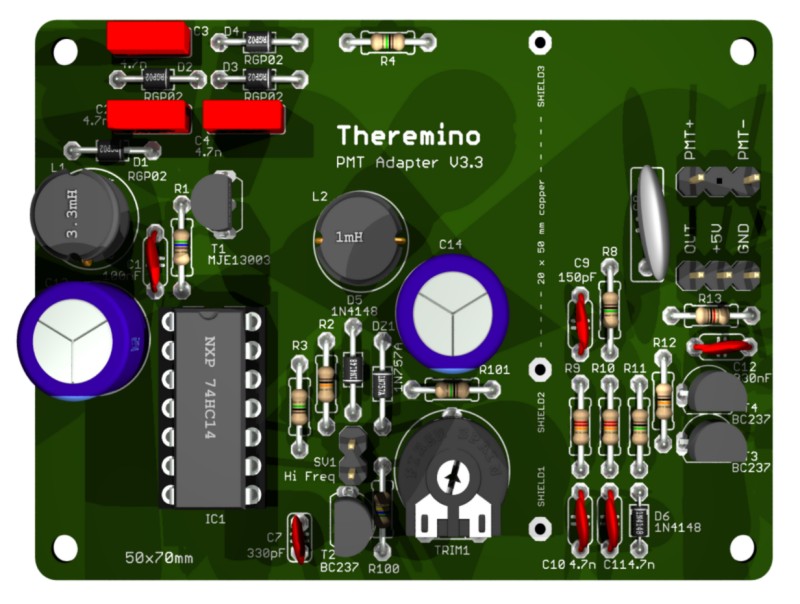
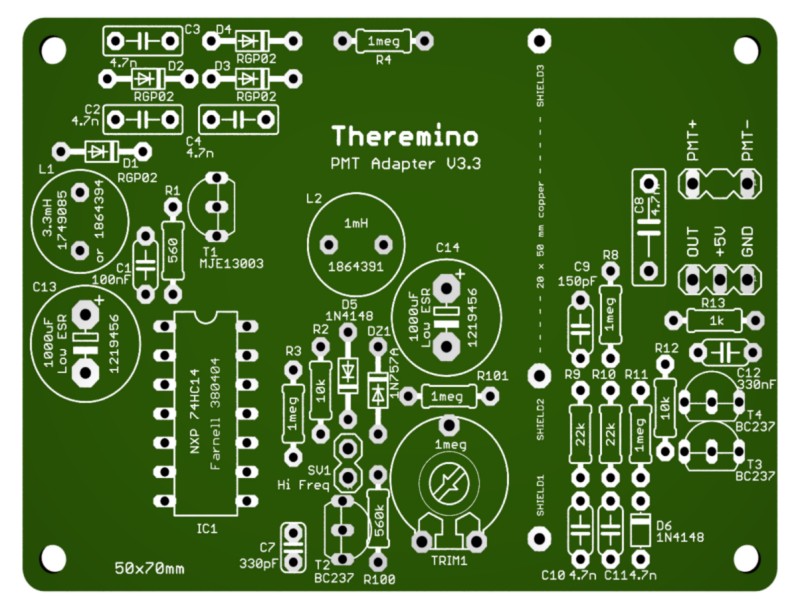
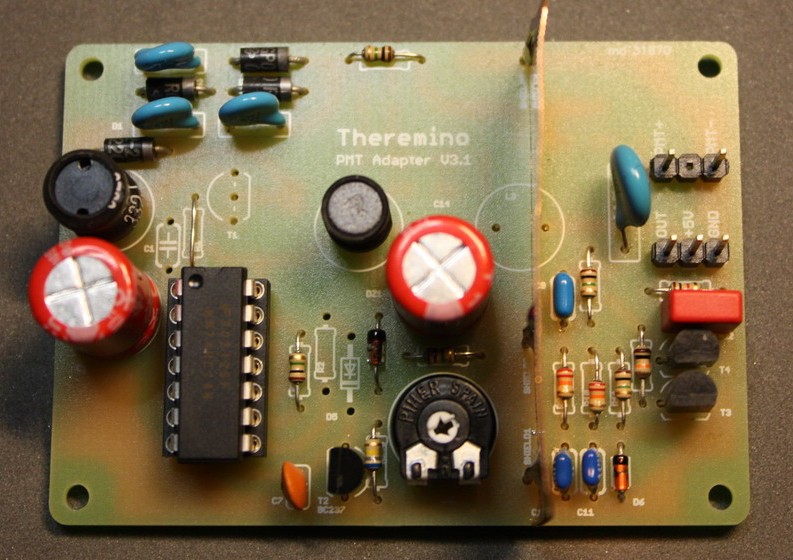
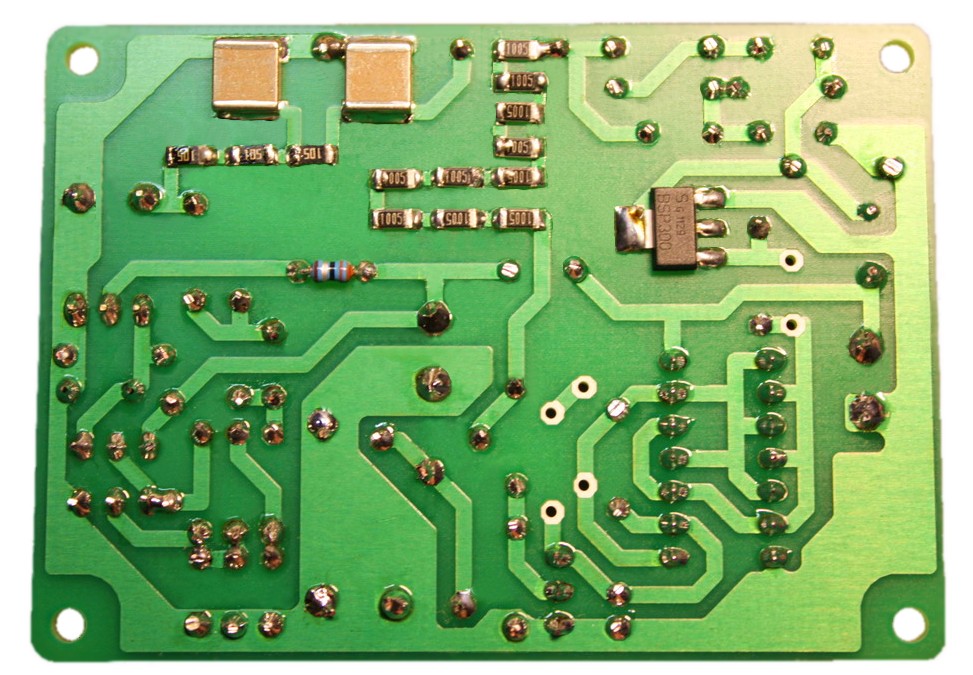
Questo file comprende il progetto del PCB, le immagini e le simulazioni SPICE: PMT_Adapter_V3.1
Questa è la versione 3.2 con molti piccoli miglioramenti: PMT_Adapter_V3.2
Questa è la versione 3.3 con ulteriori miglioramenti: PMT_Adapter_V3.3
Most salient features:
– Compact only 50 X 70 mm
– No initial thermal drift due to the feedback loop.
– Adjustable voltage from 500 to 1500 V
– Very low power consumption only 10 mA @ 5 V
– Very low ripple only 100 uV
– Protected against short circuit
– Maximum power output 100 mW
– Preamp circuit and pulse enlargement (from 3/5 uS to 100 uS to be read by a PC sound card)
Caratteristiche tecniche:
– Compatto solo 50 X 70 mm
– Nessuna deriva termica iniziale grazie al circuito di retroazione.
– Regolabile in tensione da 500 a 1500 V
– Consumi molto bassi @5 v solo 10 mA
– Ripple bassissimo solo 100 uV
– Protetto contro il corto circuito
– Potenza max erogata 100 mW
– Circuito di preamplificazione e allargamento degli impulsi incorporato (porta gli impulsi da 3-5 uS a 100 uS per essere letti da una scheda audio del PC)
La costruzione semplice e ordinata riduce i difetti di costruzione e li rende immediatamente evidenti.
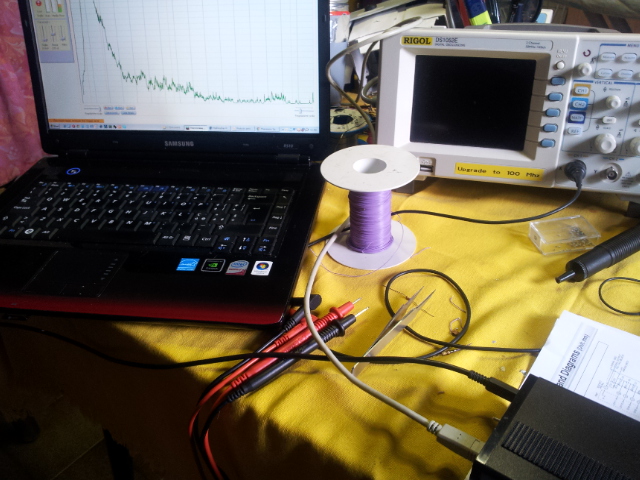
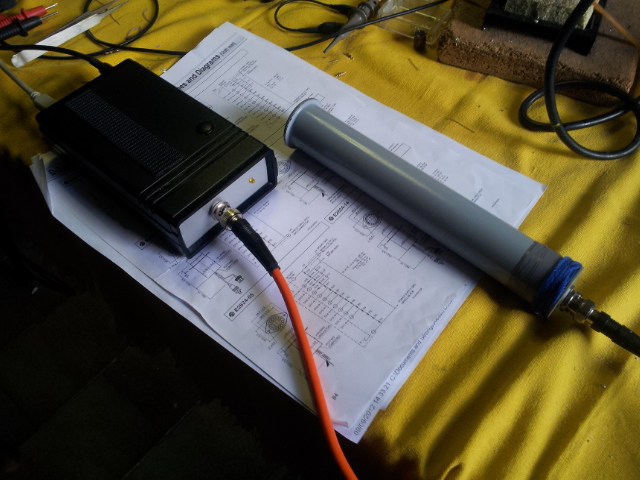
Nelle seguenti immagini si vede il PMT durante le prove.
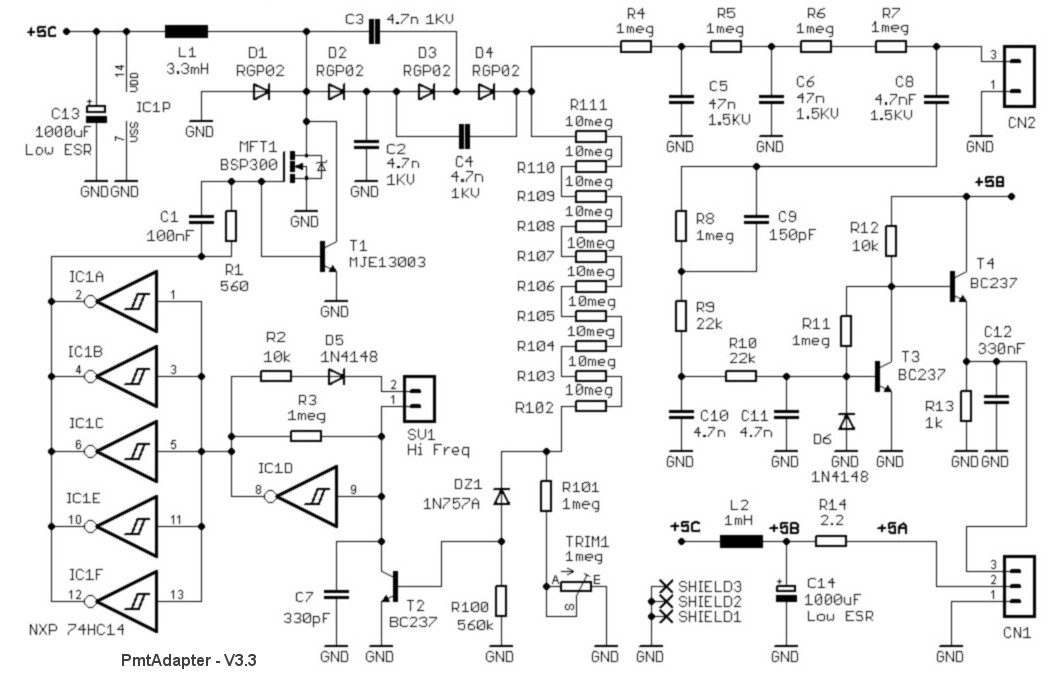
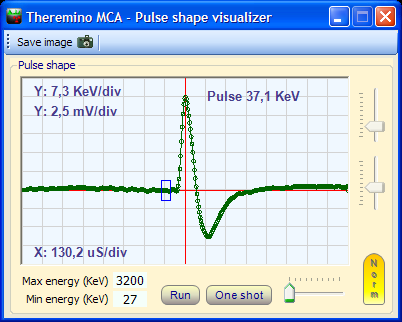
Lo schema elettrico e un impulso di esempio che mostra il livello di rumore dell’alimentatore, notare che si tratta di un impulso di bassa energia.
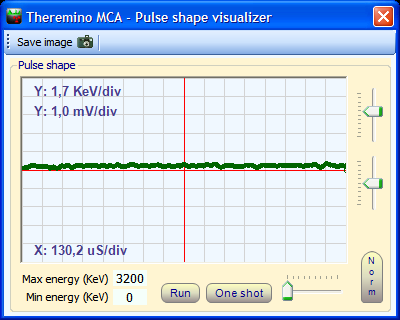
Nelle ultime versioni di PmtAdapter il rumore è inferiore ai 100uV. Praticamente il solo rumore dovuto al campionamento a 16 bit della scheda audio, come visibile nelle due immagini seguenti.
La prima immagine mostra il rumore della sola scheda audio, la seconda il rumore con il PmtAdapter collegato.
——————-
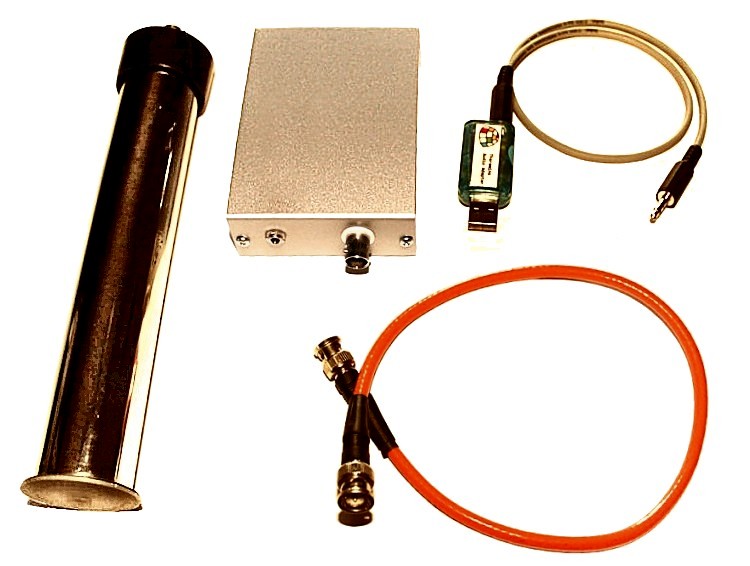
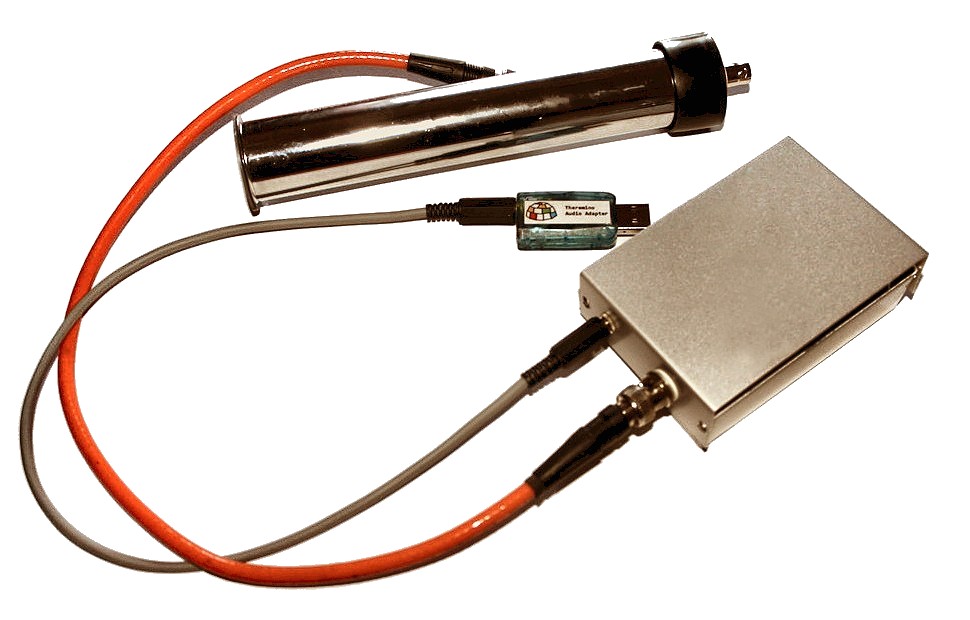
Il sistema completo
———————
Il Pmt Adapter non è in produzione, è possibile costruirlo ma contiene un certo numero di componenti speciali, difficili da reperire e costosi. Per cui si consiglia di rivolgersi ad Lello, che sa come reperire i componenti a buon prezzo e ha anche fatto stampare un certo numero di PCB per gli amici: ufficiotecnico@spray3d.it
Il team del sistema Theremino si occupa solo di ricerca e non vende hardware. Il sistema é completamente “Freeware”, “Open Source”, “No Profit” e “DIY”, ma esistono produttori che possono fornire i moduli assemblati e collaudati a un ottimo prezzo. Difficilmente si potrebbe auto-costruirli spendendo meno. Per un elenco dei produttori leggere questa pagina: www.theremino.com/contacts/producers
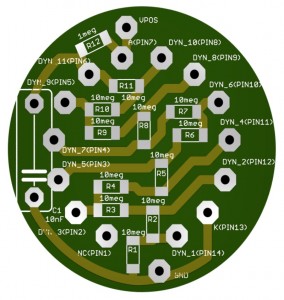
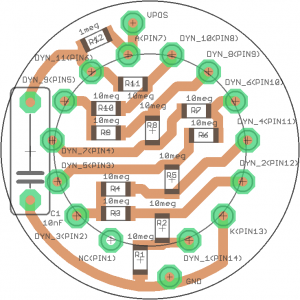
Uno zoccolo per il PMT Hamamatsu R6095 (e simili)
In questo file ZIP il progetto completo Eagle e il file GCode per la fresa: PMT_Socket
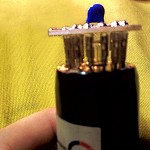
Queste immagini illustrano come adattare i connettori allo stampato e come viene lo zoccolo finito (fare click sulle immagini per ingrandirle)
Il condensatore potrebbe anche essere saldato dal lato opposto (con due tubetti isolanti sui reofori) e, per evitare cortocircuiti con il tubo di alluminio esterno, è bene avvolgere tutta la zona dal tubo PMT al circuito stampato, con un foglio di plastica isolante.
Un sistema MCA per Apple (iPhone e iPad)
A grande richiesta Alessio ha studiato una versione speciale di PmtAdapter, usabile con il software disponibile su iPhone e iPad. Il software si chiama Geiger bot, ed è un riferimento per la comunità Apple.
Lo schema elettrico è molto simile al PmtAdapter per PC, ma è stata aggiunta una batteria (non c’è la alimentazione USB). Inoltre il segnale viene ridotto notevolmente di ampiezza, per poterlo inviare all’ingresso microfonico, che altrimenti saturerebbe e distorcerebbe la forma degli impulsi.
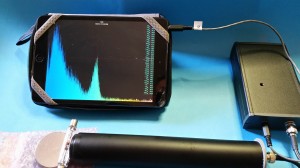
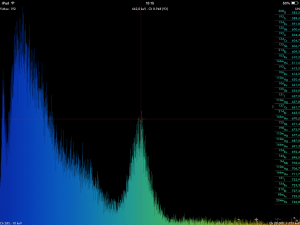
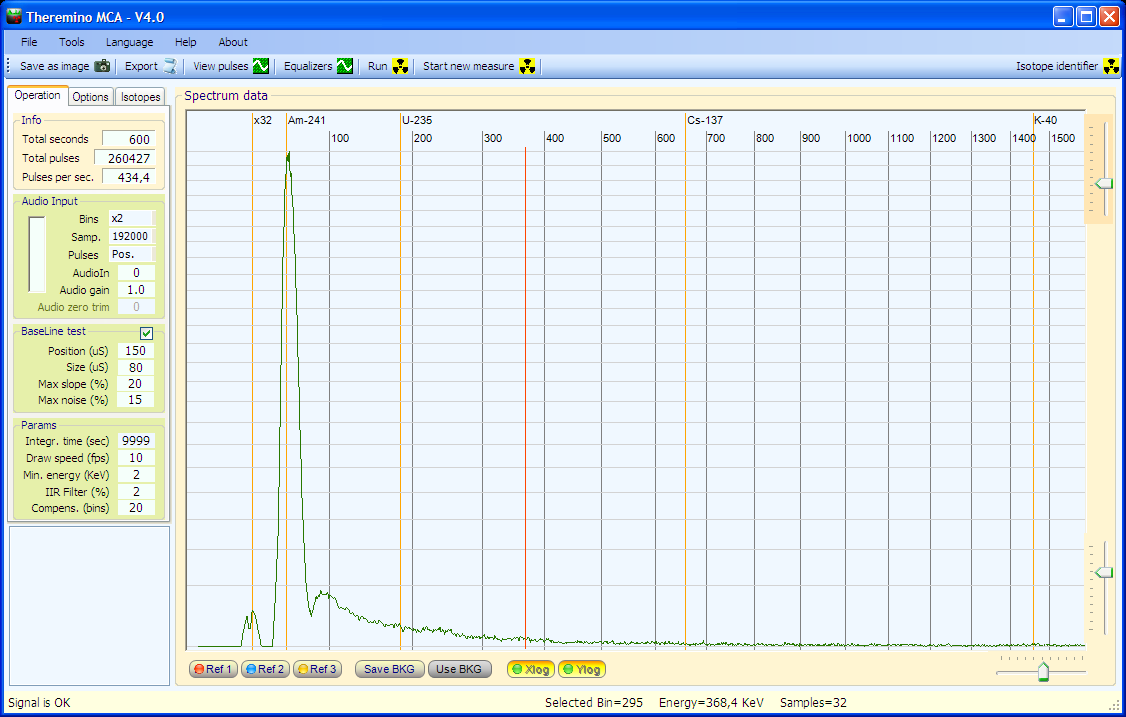
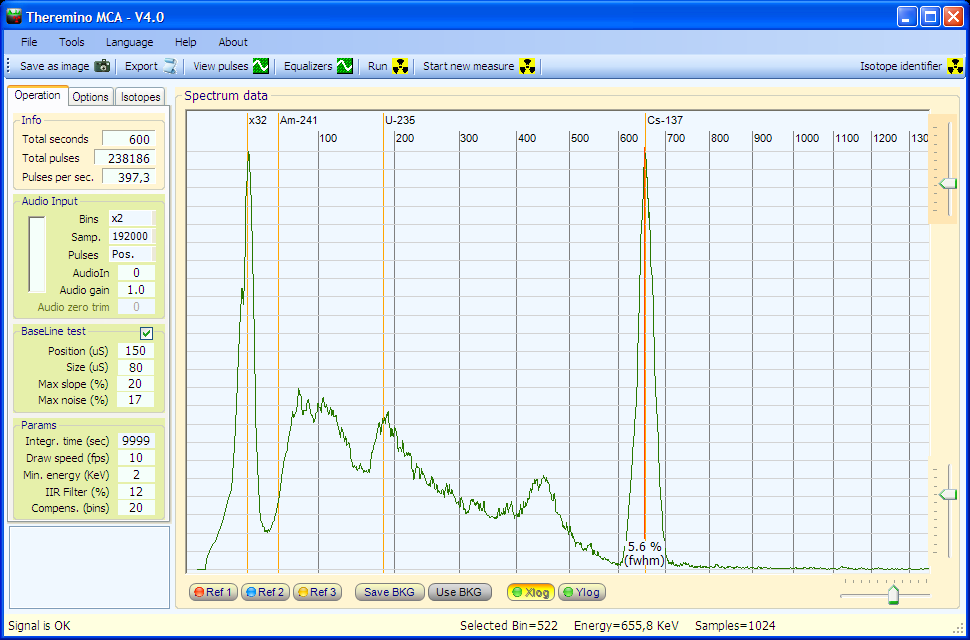
Qui si vedono gli spettri ottenuti con Americio e Cesio. Grazie alla meravigliosa risoluzione dei display “retina”, le scritte sono così piccole, che non disturbano la visione del bellissimo sfondo nero.
Siamo lontani anni luce da un vero MCA, la larghezza delle righe “FWHM” (che è il parametro più importante per un MCA) è esagerata. I particolari minori dello spettro sono completamente invisibili. Ecco gli stessi spettri prodotti da Theremino MCA:
Con un Tablet 12 pollici da 180 euro (con Windows 10 e spedizione compresi nel prezzo), si avrebbe uno strumento portatile molto più comodo e preciso. Ma la soddisfazione di usare un sistema Apple, che costa una esagerazione, non ha prezzo!
Calibrazione e temperatura
Il Pmt Adapter e il fotomoltiplicatore consumano solo poche decine di milli Watt, che non sono sufficienti a provocare variazioni di temperatura significative. Quindi non è necessario attendere un “tempo di riscaldamento” tra la accensione e le misure. E non c’è nemmeno un riscaldamento progressivo durante misurazioni molto lunghe.
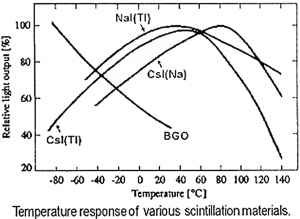
Però i cristalli scintillatori cambiano rendimento con la temperatura ambiente, come si vede nella seguente immagine:
Si noti che la risposta alla temperatura non è lineare e che cambia addirittura pendenza da positiva a negativa, proprio nella zona delle normali temperature ambiente. Per cui una correzione automatica sarebbe imprecisa. Ci vorrebbe una tabella di correzione da calibrare per ogni cristallo e questo sarebbe molto complesso e in definitiva poco affidabile. Molto meglio effettuare una taratura con due marker prima di ogni misura.
Effettuare un controllo con i marker prima di ogni misura è un sistema rapido, preciso e molto affidabile. Si consiglia di mantenere sempre in posizione due piccoli campioni (ad esempio Cesio e Americio) a distanze opportune, in modo da avere sempre due piccole righe di riferimento. Il Cesio è più debole e lo si tiene abbastanza vicino alla sonda mentre l’Americio lo si tiene a una decina di centimetri, oppure lo si racchiude in una capsula, per diminuire la sua attività e poterlo tenere vicino alla sonda.
Le due righe dovrebbero essere della stessa altezza e abbastanza piccole da non disturbare le misure. Se non si devono misurare proprio il Cesio e l’Americio, allora i due marker possono stare sempre in posizione. Vedere le loro righe sul grafico finale (eventualmente commentate) da la sicurezza che il grafico è perfettamente calibrato.
Costruire un pozzetto in piombo
Da usare per misurare il Livello di Radioattività del fondo naturale e di sostanze debolmente radioattive.
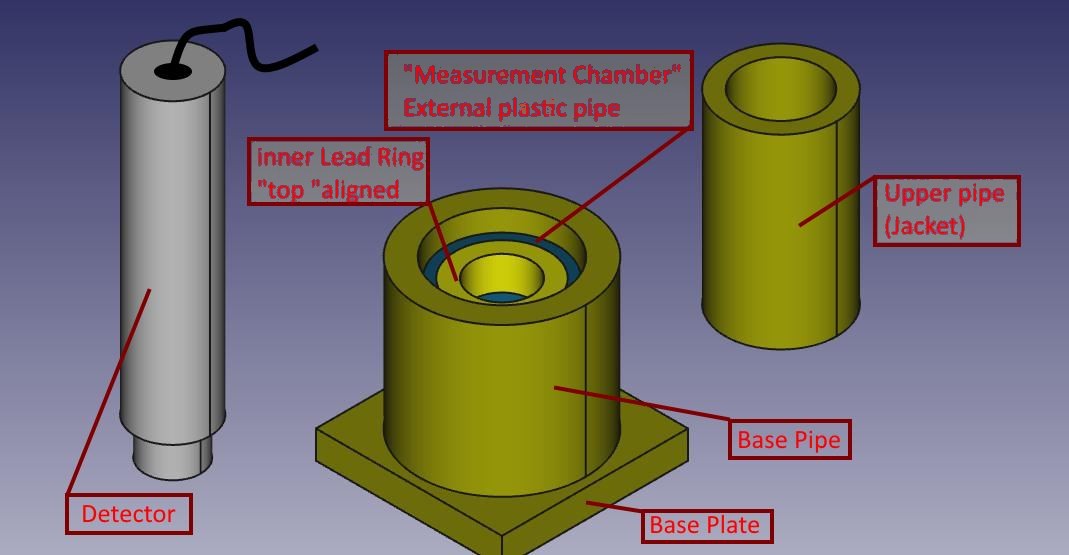
Il pozzetto di misura è costituito da una piastra di base, più alcuni cilindri concentrici, di varie misure e spessori. Tra i componenti si lascia un po’ di lasco, per facilitare l’assemblaggio.
Il materiale color ottone in realtà è il piombo, per distinguerlo dall’alluminio grigio della sonda, mentre il pezzo di cilindro interno (appena visibile) è l’unico di plastica, con anello concentrico e solidale in piombo.
Tutte le parti in piombo sono state realizzate a partire da lamiera da 1,5 mm di spessore, tagliata con una comune forbice da lamierino e sagomata a mano avvolgendola intorno a cilindri di alluminio/acciaio/plastica che avevo a disposizione (utilizzati solo come “dime”).
La piastrina di base è stata realizzata piegando più volte una striscia di lamiera di pari larghezza, ottenendo alla fine un discreto spessore.
La lamiera si piega facilmente attorno al bordo dritto di un tavolo e si appiattisce con colpetti di martello. Il piombo infatti è molto malleabile.
Tutti i pezzi sono stati avvolti con del nastro di carta sufficientemente largo, in modo che maneggiandoli non si viene in contatto diretto con il piombo, che tende sempre a sporcare le mani. Anche per questo è bene calcolare un po’ di lasco tra i vari diametri dei pezzi, in modo poi che il rivestimento di carta non crei problemi all’inserimento/sfilamento dei cilindri stessi, che parzialmente devono entrare uno dentro l’altro (come per il cilindro di base e la camicia superiore)
Per misurare si segue questo schema:
- Si pone innanzitutto su di un tavolo la piastra di base ed il cilindro di base;
- Si inserisce il campioncino da sottoporre a test dentro il tubo di base, in modo che sfiori la parte interna (più bassa) dell’anello della camera di misura: si possono infilare sotto ad esso degli opportuni distanziatori;
- Si mette la camera di misura (cilindro plastica ed anello piombo solidale) in modo che il sottostante campioncino sia centrato sul fondo dell’anello;
- Si infila la camicia superiore all’interno del cilindro di base: essa si appoggerà al tubo di plastica e si manterrà concentrica al foro dell’anello di piombo in modo da permettere il successivo inserimento della sonda;
- Si inserisce la sonda : nel mio caso a incastro nell’anello di piombo della cameretta di misura.
Dalle prove che ho fatto questo setup riduce il rumore di fondo da quasi 20 cps a 3,1 cps
Marco Russiani
Download di questo progetto, completo di ulteriori informazioni e immagini:
![]() Theremino_Pozzetto_di_Misura_ITA.pdf
Theremino_Pozzetto_di_Misura_ITA.pdf
![]() Theremino_G-Ray_Test_Chamber_ENG.pdf
Theremino_G-Ray_Test_Chamber_ENG.pdf






lascio un piccolo contributo a chi vuol partire a usare il programma :
Prima cosa si deve settare il volume dell’ingresso audio per minimizzare i picchi nella casella “over range pulses”
Possiamo settare impulsi negativi con l’apposito tasto
La regolazione Noise deve essere appena sopra il livello (si regola con il trigger)
Il dead time deve essere regolato in maniera da non avere “pileup” (dipende dalla larghezza dell’impulso) e andrebbe controllato con l’oscilloscopio.
Il filtro serve per avere un grafico più morbido e vedere velocemente il risultato.
Possiamo fare una misura accurata del fondo salvarlo per poi usarlo come “tara” che verrà sottratta dalla misura con il campione portando “fuori” solo i picchi caratteristici.
E’ anche possibile memorizzare una misura e tenerla per confronto con “Ref1”
Il controllo “Trim scale Right” serve per comprimere o allargare lo spettro e tararlo sui picchi caratteristici e noti dei campioni usati.
Il controllo “Trim scale Left” serve per transarlo destra / sinistra e va usato con il comando precedente per aggiustare la scala.
Alessio, grazie delle istruzioni che sono molto utili dato che, per ora, le istruzioni associate al programma sono minime e che non so proprio quando avremo tempo di completarle.
Vorrei solo aggiungere un particolare importante:
Alcune schede audio invertono gli impulsi e anche alcuni adattatori del segnale lo fanno. Per cui e’ difficile essere sicuri della polarita’ degli impulsi. Questo viene ulteriormente complicato dal fatto che alcuni oscilloscopi software e registratori audio, come “InTune” ad esempio, mostrano gli impulsi con una polarita’ mentre altri li mostrano con la polarita’ contraria. Tutto questo e’ dovuto al fatto che per un segnale audio la polarita’ degli impulsi non e’ importante e che quindi non esiste uno standard sicuro per definire quale e’ la VERA polarita’.
Pertanto il tastino “Neg.” deve essere premuto o rilasciato con il seguente metodo:
– Se la polarita’ e’ giusta tutto lo spettro si sposta verso destra e l’indicatore “Peak” sale di piu’
– Se la polarita’ e’ sbagliata tutto lo spettro si sposta verso sinistra e l’indicatore “Peak” non si muove quasi
Hello,
MCA looks like nice program. Downloaded both versions- with source and without source. Neither program will run. Error message says “failed to initialize”. I am using Win XP. Is that a problem?
Also, is source code available in VB6?
George
You should install “Dot Net 3.5 SP1” from:
http://www.microsoft.com/en-us/download/details.aspx?id=22
The source code is only in VbNet.
bye
Livio
Gentlemen,
Congratulations on designing this excellent gamma spectrometry software. I have tested it with my GS-1100A and I get very good results.
With your permission I would like to link my web site to your page.
Please advise if this is okay.
Best regards…
Steven Sesselmann
Yes, you can link our page.
Thanks for your appreciation, and sorry for some unfinished features,
in some days we plan to complete the 90% of the program.
Bye
Livio
Livio,
I have set up a page with a link back to here. Is this the best page to direct people for downloads?
Also let me know if you want me to mention any specific or unique features.
http://www.gammaspectacular.com/index.php?route=product/category&path=69_88
Steven
Thanks for your link.
Your text is OK. and the linked page also.
…maybe you can specify better the name of the program “Theremino MCA”
If for you is OK we can link your site here: https://www.theremino.com/contacts/references
Linux and Mac
————————————————-
About Mac and Linux versions you can write to our expert of “alien” systems: Roberto at development@theremino.com
Many of our software can work on Linux and Mac if installed properly:
https://www.theremino.com/downloads/linux
https://www.theremino.com/downloads/mac-osx
but my time is limited and I produce and test our software only for XP, Vista and Windows7 (32 and 64 bit)
I do not know what is “Crossover”, all the Theremino software uses the Mono system that is cross-platform on Linux and Mac
For my experience all our software when executed on Linux and Mac is not so efficient and stable as on Windows. Windows is always better for scientific usages.
If someone thinks to be able to do this on Linux or Mac, please do it, all our software is “Free”, “Open Source” and “Modular”
Maybe for Linux and mac users you can write on your page that they can write question to development@theremino.com
Bye
Livio
Theremino MCA is a great spectrometry program. I appreciated the time and effort your team have put into creating it, plus providing it to the community.
You have just updated it to version 2.4. There is more trim right in 2.4. The trim right scale setting maximum setting has increased from 900 to 1200.
I am using a windows vista laptop, works fine with PRA. Using the on board sound card with the mic/line in set at 96K. The maxim peak position I can get for Bismuth Bi-214 at present is 386 Kev with the 1200 trim right maxium setting.
I estimate it needs to have a maxium setting of at least 2000 for trim scale right to accommodate a lot of scintillators out there, to get peak calibration correct.
The maximum energy is 3200 KeV. To see also the high energy peaks you need to reduce the level of the audio signal by acting on the Windows audio mixer (please note that there are two mixer – Playback and Recording)
If the audio signal is too much the audio card cuts the high energy pulses and nothing can be done in software to correct this. Please follow the program indications “Increase the audio signal” and “Reduce the audio signal”
The audio mixer level is correct when:
– the program says “Signal OK” for the 99% of the time
– the peak meter is from 50% to 90%
I can see the high energy peaks clearly, it is just that the scaling in out. For example with the present maximum right trim in ThereminoMCA version 2.4, K40 is positioned at around 900 keV.
If K-40 is at 900 KeV with the TrimRight at maximum then your audio signal is very little.
Please follow the program indications “Increase the audio signal”
To increase the audio signal you must open the Windows “recording” mixer
and increase the appropriate slider regulation.
The audio mixer level is correct when:
– the program says “Signal OK” for the 99% of the time
– the peak meter is from 50% to 90%
If you can not increase the signal beacause the Windows mixer is already at 100%, or because you can not find the “recording” mixer, please specify better your problem and we will find a solution.
In the future versions of ThereminoMCA maybe we will add a “Audio gain” control that will help you in this situation.
Bye
Livio
From: John Doe
To: geigercounterenthusiasts@yahoogroups.com ; GammaSpectrometry@yahoogroups.com
Sent: Sunday, November 04, 2012 10:19 PM
Subject: [GammaSpectrometry] Theremino test for busy people [2 Attachments]
Perfect!
———————————————-
Downloading : 30 second
Installation : 30 second
launching : immediate
connection of the probe : 60 second (I had to search my adapter in my desk)
Reading the documentation : 0
Setting and adjustment : 5mn (just push all the buttons randomly and check the screen)
acquisition and first result : less than 30 second
Total 10mn to see what takes hours with other software (see pictures)
Many thanks for this superb product!!!!
And he bonus is an excellent resolution and a good energy scale setting if your probe is linear.
Alain
Thanks for your good testing.
We are receiving many other tests useful for a good calibration.
Some videos here:
http://www.youtube.com/watch?v=P_WpkaLX0BQ
http://www.youtube.com/watch?v=r2l2vb0Xeok
I tested Theremino and I found it really easy to use.
I was not able to get sensible results from any other software as yet due to the learning curve and not having any working equipment to compare to.
At least I was able to get a plot right away with your application and as such this is a major milestone in my journey into Gamma Spectroscopy.
Curious if you have implemented the Isotope Identification feature yet. I found the Isotopes.txt file in the Extras sub directory and modified it but the application does not seem to be showing the isotopes I added.
Regards,
Allan
Thanks Alan for your contribute to our discussions and researches.
The “isotope identification” is not implemented now, and maybe we will not implement the raw “identification” and the associated semi-manual methods like the “area of interest”.
But we are studying a new method, similar to the “peak fitting” that, in our intentions, will be capable to identify the “signature” of the isotopes and then to accurately measure their relative abundance.
Please note the use of the word “relative”: when measuring radiations, the value measured depends from so many factors that there is not a “true” value. Beware of those who claim to deliver a absolute value!
Please wait some time, in the future versions of ThereminoMCA we will implement also the “Baseline restoring” that is very important in order to clean the peaks, reduce the noise and to speed-up the graph creation.
Bye,
Livio
Hi Theremino team,
I made little changes in your code “Isotope identifier”.
Source, builded application and short documentation I sent you on mail.
I hope that I gave little contribution to make this application better.
In the future I’ll give all I can to help you with improvements.
Please let me know if this is Ok.
Tom 9A5TOM
So, gmail blocked mail and I needed to delete file Theremino_MCA.exe
from folders:
\Theremino_MCA_V2.4_WithSources_new_ver_Tomy\ThereminoMCA
\Theremino_MCA_V2.4_WithSources_new_ver_Tomy\obj\x86\Release
I sent it again.
After you build/rebuild your solution you’ll get it again.
Tomy 9A5TOM
The best method to send files is to use 7zip (or rar)
Normally we use 7zip that is freeware and a very good software!
Hi Livio,
I sent new version wiht multiresults isotope identification for exact energy and close to energy.
Second change is selective marking of exact isotope energies markers for comparison and calibration.
Hope it will be useful in one of the next version of application.
Tomy
Because we have not the time to merge the new versions every day, we will include in the distributions your versions.
Then, when all the experiments will become more stable we will do a final merging.
Bye and a great thank for your help.
Livio
Just carried out a comparison test between PRA and Theremino, using an identical setup. same volume same detector, same sample rate 192khz etc. The only difference was a switch of software. The resulting spectrum from PRA showed sharper peaks and better resolution at 662 keV.
Ok for same volume same detector, same sample rate 192khz etc.
But why not to mention the aquisition times?
And why not to say that at low energies the opposite happens?
In other words: it is easy to add some resolution by removing 99% of good samples, but this increases so much the acquisition time that the system becomes not-useful.
In order to get good resolution in useful time it is not a good idea to remove samples like PRA does, but it is better to use a low noise power supply and a good pulse shaping.
Many tests have shown that the row enlargement takes place only in case of very noisy signal. To be more specific: in case of signal from CCFL type power supply with a frequency of about 3 KHz (thus very low and hardly filterable)
The only method to get a low noise signal is to use a power supply working at high switching frequency (more than 100KHz)
In addition the pulse shaping circuit must generate pulses with a long rise time (> 50uS)
If the pulses are not shaped correctly a strong “ringing” is produced and the peaks are enlarged.
Thanks,
The new Audio Gain feature in Theremino MCA 2.6 fixed my peak position issue.
I also like the fact that it now has an isotope identifier built in. For this to be really useful you need to have a lot of accuracy in the peak positioning in the chart.
One suggestion I would make is that a lot of PMT in scintillators have non linearities that affect energy scaling. In other words you need an exponential adjustment to compensate for this.
You can correct for this in PRA by using the following procedure. This adjustment info was provide by Steven of Gamma Spectacular.
You can correct for this, if you record a spectrum with three known peaks, then export the data into excel, where you can create a new calculated column with a small additional exponential factor.
So you have three adjustment numbers in the function.
1) The multiplier (X) – this sets the gradient of the function
2) The konstant (K) – this sets the height on the Y axis
3) The exponent (e) – this number creates the curvature in the function
Energy = (((arb.units) * X)^e) + K
Peter
The isotope identifier is based on a preliminar work of Tomy (9A5TOM) and is not well tested by us.
We will not do a “Identifier” but we are making a good “Peak Fitting” algorithm.
But, as you correctly write, before to start with the Peak Fitting, we need to test, linearize and improve many things.
We are making researches on the non-linearity sources and thanks for the PRA formula that seems to be an improvement of the formula used in the PRA 5: Energy = arb.units * X + K
We think that the new formula Energy = ( arb.units * X ) ^ e + K (removed unnecessary parentesis)
is a little better than the old formula but we are trying to do better (maybe with a “spline” or with a interpolated “lookup table”)
The ” + K ” is shurely an error because it translates ALL to the left and produces negative energies that are not-real.
—————————
Please wait some time, we will do this in the best possible way.
If you can help with other formulas or ideas please do it, we appreciate your contribution, thanks.
bye
Livio
Sto giocando col baseline restoring.
Ho visto il quadratino intorno al picco che si allarga in funzione del cambio dei parametri.
Cosa si intende esattamente con baseline restoring?
Mi cambia molto il grafico , con o senza questa funzione
Il Baseline Restoring aiuta in caso di segnali con la linea di zero instabile.
Nella pausa tra un impulso e l’altro il segnale audio dovrebbe stare a zero ma, per molti motivi, quasi tutti gli hardware per la spettrometria producono segnali con la linea di zero che balla continuamente su e giu di qualche decina di millivolt rispetto allo zero.
Solitamente quando gli impulsi sono molto frequenti la tensione di zero scende e viceversa.
Una tensione di zero instabile produce un allargamento delle righe e questo effetto e’ maggiore per le righe di bassa energia che, essendo piccole, vengono molto influenzate dalla linea di base su cui poggiano.
Per vedere l’effetto del Baseline Restoring
——————————————————————————————————-
– apri il visualizzatore di impulsi e imposta di visualizzare solo energie da 50 a 120 Kev
– in queste condizioni vedrai che:
– senza BaseLineRestoring la linea di zero sale e scende un po’
– con BLR la linea di zero viene stabilizzata
Solo se stai guardando impulsi piccoli puoi notare il benefico effetto di stabilizzazione, perche’ poche decine di mV su un segnale piccolo sono significativi e visibili, mentre paragonati a impulsi da 1 Volt sono ininfluenti e anche troppo piccoli per vedere il loro effetto di spostamento.
L’effetto benefico sul grafico non e’ molto e si nota solo sulle basse energie inoltre se non perfettamente regolato per il tipo di segnale e di rumore della tua sonda puo’ anche peggiorare il grafico. Per cui se non sei sicuro e’ meglio tenerlo disabilitato.
Le due regolazioni sono la posizione e la larghezza della zona dove viene campionato il segnale. Questa zona deve stare prima dell’impulso, prima del ringing, ma non troppo lontana e abbastanza grande da integrare il rumore bene e stabilizzare al meglio la linea di base.
Le regolazioni Min e Max KeV del visualizzatore di impulsi
——————————————————————————————————-
Sono regolazioni utilissime per il controllo del segnale. Permettono di vedere solo gli impulsi che vengono riconosciuti in un certo intervallo di energie. Questo trasforma il piccolo analizzatore in un potente analizzatore SCA (Single Channel Analyzer) e permette di vedere comportamenti del segnale e difetti assai poco frequenti e quindi invisibili a un comune oscilloscopio.
Queste regolazioni hanno effetto solo dentro all’oscilloscopio quindi dopo averle usate puoi lasciarle come sono. Non influiscono sul grafico.
Vediamo se ti do una risposta corretta , la funzione serve per poter correggere gli spostamenti alto/basso dell’impulso , se apri l’oscilloscopio vedi il quadratino blu che campiona la parte iniziale dell’impulso(prima del ringing) bene il programma non fa altro che allinearti l’impulso sulla linea di zero.
Naturalmente il fenomeno di spostamento si verifica più facilmente con le basse energie perché si avvicinano molto al rumore.
Se metti nei parametri max Energy e min Energy due valori molto bassi esempio min 10 max 60 vedrai che la linea del segnale sale e scende molto , il comando base line restoring corregge questo in pratica ti tiene gli impulsi stretti altrimenti con quell’oscillazione li vedresti molto larghi.
Con il comando posizione sposti il punto di campionamento destra /sinistra e con size lo allarghi (in ampiezza) questi due parametri ti servono per meglio trovare il punto di campionamento ne troppo lontano ne troppo vicino al “ringing”, devi cercare di metterlo dove trovi almeno 3/4 oscillazioni cosi’ lui corregge in maniera efficace.
Ok Grazie. Non ho visto grandi miglioramenti. In teoria si dovrebbe vedere miglioramenti anche sui picchi a grandi energie ma non mi pare , anzi mi pare che si allarghino. Pensavo oggi che non sarebbe male una scala logaritmica delle energie per compensare il fatto che in qualsiasi sonda naTl allarga gli impulsi all’aumentare del valore di intensità (in pratica è poco coerente alle alte energie) Aiuterebbe molto a trovare a occhio gli impulsi
BaseLine Restoring.
————————————————————————————————-
Hai proprio ragione anche io ho visto che non ci sono miglioramenti ma sono sicuro che alle basse energie dovrebbero esserci. Probabilmente c’e’ ancora un errore nell’algoritmo…
Prego tutti quanti di avere pazienza, fare questi test richiede molto tempo e le parti ancora da mettere a posto sono molte.
Consiglierei, per ora, di lasciare disattivato il BaseLine Restoring.
Scala orizzontale logaritmica.
————————————————————————————————-
Potrebbe essere una buona idea, anzi ottima, potrebbe aumentare il livello delle alte energie e compattare i bins che ora sono molto sparpagliati in un qualcosa di molto piu’ visibile e riconoscibile. Inoltre la zona delle basse energie, che ora e’ molto compressa, verrebbe ampliata! Anche gli analizzatori di spettro audio hanno la scala delle frequenze logaritmica.
Spero proprio che funzioni come immaginiamo e lo proveremo appena possibile.
Grazie per il consiglio.
It is possible to correct a floating baseline in software?
(baseline correction not working)
I don’t think PRA drops all the pulses, I think all pulses are normalised first.
If no other method will work then we will implement the “Shape Recognition” (it is simple because in the right place we have all the necessary data)
But before to do this we will try any other method non involving a raw pulse decimation.
Shape recognition
——————————————————————————————————————————–
We do not know if PRA corrects the baseline shift, because the sources are closed.
But we have noticed this:
– if not using the “shape tolerance” the PRA data are so noisy to be unuseful
– to produce good results the shape “tolerance” must be a little number
– using a little “shape tolerance” the drawing speed is slowed
So we think that the PRA method is to remove pulses.
Solutions
——————————————————————————————————————————–
We have tested the “baseline correction” algorithm but it not works as we hoped.
We are triying many algorithms and i am shure that we will find a good software solution
also for the floating baseline.
bye
Livio
Amazing performance via a simple sound card and Theremino software — congratulations all around. If someone had asked me if this were possible, I would have said, no, not really. Of course, I would have seriously underestimated the ingenuity of those who come from the land of the great Enrico Fermi….. RANDALL
Un confronto fatto da Gamma Spectacular: http://www.facebook.com/pages/Gamma-Spectacular/146649762066972 mostrava che il FWHM del PRA (8.7%) era migliore di quello di Theremino 2.6 (11. 2%) cosi’ ci siamo dati da fare e ora il FWHM della versione 2.8 e’ sceso all’incredibile 7.2%. che si puo’ vedere nelle immagini di questa pagina: https://www.theremino.com/blog/gamma-spectrometry/images
Ringraziamo molto Steven Sesselmann che ci ha prontamente inviato i file audio necessari per risolvere questo problema. E non ringrazieremo mai abbastanza Marek Dolleyser che, con il suo PRA, ha aperto la strada a tutto questo.
I’m testing the 2.9 version. Interesting the feature to automatically calculate the Fwhm. I could see my halfgood probe is 13% while my best is 8.2. If I use the baseline restoring oprion , it drop down to 7.2. Nice feature. The low energy treshold can be lowered to 0 kev with no pileup . The lower 31 kev peak is very small but don’t know if it is partially cleaned or it is partially deleted. . Very nice result. Have fun
Sono capitato per caso sul vostro sito.
Incuriosito, ho scaricato Theremino MCA v. 2.7.
Subito andato a bomba. Surclassa PRA che sto usando da mesi.
Facile, velocissimo, preciso. Ora ho messo sotto il torchio la versione 2.9. Sembra un ulteriore deciso miglioramento. Vi saprò dire.
Per ora complimenti e andate avanti.
Ci sentiremo preso. Antonio
I’m testing now the 2.10 from Tomy. I could use the baseline r option and works great reducing noise at low energy. Livio , I suggest you to include the Tomy modify as they are really nice and nicely working.
I am working to integrate the Tomy Identifier in the main program… but today is a very difficult day – everyone phones here.
Maybe i can finish (with some bug) before 21.00
Bye to all.
Livio
The Tomy Identifier is now integrated in the “Tools” menu (with some little bug)
PRA 4.4.1 verses Theremino MCA 2.12
See the PRA and Theremino rain swab test charts showing significant Radon decay daughter isotopes captured from the edge of a storm, here on the east coast of Australia, on the evening of the 17th. This test was done using PRA and Theremino MCA software, running on the same computer at the same time. Audio setting was set at 96K sampling.
There are a couple small peaks that appear in both software charts that could indicated the presents of a small amount of U-235, plus there is also another peak to the left of the Bi-214 peak that maybe Beryllium Be-7. Won’t know for sure until I retest in a few days.
http://sccc.org.au/wp-content/uploads/2012/11/Rain-Swab-4x-17.11.12-PRA-9hrs.jpg
http://sccc.org.au/wp-content/uploads/2012/11/Rain-swab-4x-171112-T-9hrs.jpg
The lower chart in the Theremino V2.12 screen capture is a reference after the first 15 minutes of testing, and the higher chart is after 9hrs. The Pra V4.4.1 chart is also after 9 hours.
PRA is still seems to have better resolution at lower keV energies than Theremino. Theremino is very quick at showing the main peak energies, and magnifying the higher energy peaks using the Energy Compensation feature.
Thanks for this good test!
For the future test I can suggest little improvements:
– to save always a complete image with all the controls visible
(so it will be possible to see the test conditions)
– to use the baseline correction that (if correctly trimmed) increases greatly the resolution
As a good starting point use:
– 50 and 50 in the BaselineCorrection
– 250 uS for the DeadTime
Do not change this values before to test them, use 50, 50 and 250 and see that the resolution is increased.
If 50,50,250 does not increase the resolution then, please, send to us the audio file (or specify a test audio file if already present in the test file list)
bye
Livio
Some users suggested to find a good method to isolate from noise the net peak area.
This is needed to:
– count pulses in the peak area
– calculate a significative FWHM also for little pulses, on a high noise floor
We will try to do this with some different methods and some time will be needed
for the selection and the final approvation of the best method.
Now this problem is in the ToDo list because we are in the middle
of a drastical revolution of the program, and we can not publish it.
The next version (V 3.0) will introduce many important features:
– “Graphical Equalizers” for Energy Linearization and Amplitude Compensation
– Automatic Linearization and Compensation
– Selectable logaritmic scales for X and Y axis
– Audio Input modified to work normally not with 0dB, but with -10dB audio level
(this avoids to work near to the audio card saturation zone)
– Ability to work well also very low audio signals
– All the controls reorganized with the most important controls over the first tab
– Docking of the Pulse-Shape-Window and Equalizer-Window
– Ability to decrease the refresh time for slow systems (Linux…)
– Bin numer in the XRF area ten times increased
bye
Livio
Volevo ringraziarvi pubblicamente da parte mia e da parte delle numerose persone che hanno assistito ieri ai miei percorsi Didattici.
In totale hanno assistito più 100 persone in 4 sessioni di laboratorio che ho fatto al “Festival delle cose invisibili” a Montelupo F.no un numero sopra le aspettative, ho avuto parole di elogio e complimenti per l’ opera di divulgazione , ma soprattutto i complimenti per il lavoro fatto dal team Theremino per quanto riguarda l’analizzatore multicanale.
un saluto ,Alessio.
Desidererei sapere a che punto di sviluppo si trova il PMT Adapter
e se è almeno disponibile uno schema elettrico dello stesso
Cordiali Saluti
Fiorenzo
Il PMT adapter sta impegnando il 90% del nostro tempo… stiamo cercando di ottenere il minimo del rumore, un perfetto impulso bipolare che non generi sbandamenti nella tensione di base, il minimo consumo di corrente, la massima stabilità in temperatura e anche di usare pochi componenti, facili da reperire.
Mettere insieme queste caratteristiche è un lavoro lungo, chi volesse aiutarci nelle ricerche potrebbe scaricare il progetto attuale da qui: https://www.theremino.com/files/PMT_Adapter.zip
Si tratta di un progetto “Eagle” e di simulazioni “LTSpice”, nella cartella “Immagini” i file principali sono visibili senza installare nulla.
In questi ultimi giorni abbiamo fatto modifiche per stabilizzare meglio il circuito di retroazione ma si possono vedere solo installando PSpice e aprendo il file: “Alim_FixedFreq_6.asc”.
Senza queste modifiche si possono verificare:
– “saltellamenti” sopratutto quando si impostano tensioni basse (sotto ai 700 Volt)
– improvvisi “salti” di tensione al cambiare della temperatura anche di decine di volt
– possibili blocchi dell’oscillatore alle alte tensioni (spegnere e riaccendere)
Il consumo in tutti i casi si aggira sui 30..50 mA e il rumore dovrebbe essere inferiore al millivolt picco-picco (ma attenzione anche ai collegamenti con la scheda audio e di alimentazione, se si entra da un ingresso microfonico aggiungere un resistore da 12k in serie all’ingresso e VICINO all’ingresso “mic” o DENTRO alla scheda audio)
Consigliabile anche alzare i due resistori di filtro R5 e R6 da 100K a 1Mega, questo abbassa leggermente la tensione sul tubo (una ventina di volt) ma per il resto ha solo vantaggi.
Abbiamo ottenuto il miglior funzionamento del PMT (un HAMAMATSU R6095) e una perfetta linearita’ di risposta, con 11 resistori da 10 Mega tra i dinodi, 1 resistore da 1 Mega tra l’ultimo dinodo e l’anodo e un condensatore da 4.7nF oppure 10nF tra l’ultimo dinodo e massa.
Ecco uno schema in formato testo…
Catodo-10M-DY1-10M-DY2-10M-DY3-10M-DY4-10M-DY5-10M-DY6-10M-DY7-10M-DY8-10M-DY9-10M-DY10-10M-DY11-1M-Anodo
– condensatore da 10nF 1500Volt tra catodo e DY11
– cavo schermato e BNC verso il PMT-Adapter, negativo al catodo, positivo all’anodo
Questo circuito si comporta già meglio di quello che si trova in giro attualmente ma ha ancora alcuni difetti. Consigliamo questa versione solo a chi ha conoscenze, tempo e strumenti adeguati per aiutarci a metterlo a punto. Per tutti gli altri e’ meglio attendere la fine delle nostre ricerche.
Per i coraggiosi che vogliono provarlo “as it is”. buona fortuna…
Livio
come si fa a vedere ‘Alim_FixedFreq_6.asc’ in PSpice?
Io ho PSpice 9.1 student edition
Grazie
Fiorenzo
Non e’ fatto per PSpice ma per LTspice e non credo che sia possibile importarlo in PSpice e comunque perderesti tutti i componenti che ho fatto io etc…
Installa LTspice è leggerissimo e vedrai che è super-veloce, semplice e completo, e poi a differenza di PSpice è gratuito per tutti, non solo per i bimbi.
Se in futuro ti serviranno librerie di componenti per LTspice chiedimele…
ciao
Livio
Se ti accontenti di una immagine scarica questa: https://www.theremino.com/files/PmtAdapter_FixedFreq_6.png
e risparmi di installare LTspice (ma ti consiglierei lo stesso di farlo, prima di LTspice ho usato tutti gli altri e ti posso assicurare che non c’è confronto – però devi conoscerlo un po’ perché all’inizio sembra troppo semplice – anche io lo avevo scartato per questo – ma mi ero sbagliato di brutto)
Molti amici ci chiamano per sapere l’occorrente per partire , ecco che ho deciso di utilizzare alcune risposte date per email e realizzare un piccolo HOWTO.
Hardware :
Occorre un tubo fotomoltiplicatore che abbia un diametro minimo di 25 mm più piccoli sono poco usabili.
Si possono trovarne usati su ebay , consiglio questo che adoperiamo anche noi nel gruppo di ricerca Theremino: “HAMAMATSU-PHOTOMULTIPLIER-TUBE-R6095”
Cristallo scintillatore :
l’ideale sarebbe un Ioduro di sodio dopato al Tallio “NaI(ti)” del diametro idoneo per essere accoppiato al tubo da temere presente che sono molto igroscopici quindi sono sigillati in un involucro di alluminio hanno una finestra trasparente (vetro) dal lato che deve essere accoppiato al tubo , da evitare quelli che presentano segni di ingiallimento indice che il sigillo è andato.
L’alternativa sono cristalli BGO (non igroscopici) o Csi(Na) , questi sensori hanno tutti e tre emissione luminosa intorno a 400 nm idonei per tubi con fotocatodo Biolkali, i cristalli plastici sono molto comuni su ebay ma non sono idonei per fare spettrometria gamma.
Su ebay se ne trovano (NaI(ti)) ex USSR hanno prezzi molto alti per cristalli fatti 30 anni fa io per esempio ho preferito ordinarne uno nuovo con lo stesso prezzo (€ 140) ho preso un 25 X 25 mm NaI(ti) certificato da 100 a 1000 Kev.
Considerare che più spesso è il cristallo più è sensibile a leggere alte energie e più costa.
Alimentatore :
Occorre un alimentatore con basso ripple , schermato e idoneo come tensione e corrente il tubo consigliato lavora con tensione massima di 1500 V io pero’ lo alimento tra 650 e 750 V perché il cristallo è molto luminoso.
Stiamo preparando un Kit di un alimentatore idoneo per alimentare i tubi più comuni , con incorporato un preamplificatore che “allarga” gli impulsi prodotti dal tubo e campionabili con discreta efficienza da una comune scheda audio del PC.
Il costo del Kit si dovrebbe aggirare sui 30 Euro , per chi lo volesse pronto all’uso si potrebbe realizzarlo concordando il montaggio.
Altrimenti si può acquistare pronto qui:
http://www.ebay.it/itm/GS-1100A2-USB-HV-Bias-Driver-for-Scintillation-Detector-/170702786085?pt=AU_B_I_Electrical_Test_Equipment&hash=item27beadce25&_uhb=1#ht_1730wt_954
Software:
è open source scaricabile gratuitamente qui :
https://www.theremino.com/downloads/radioactivity
IMPORTANTE, stiamo lavorando continuamente per migliorarlo e renderlo più preciso e affidabile possibile , è utile pertanto seguire costantemente gli sviluppi anche attraverso i vari blog qui di seguito.
https://www.theremino.com/blog/gamma-spectrometry
https://www.theremino.com/blog/gamma-spectrometry/signal-filters
https://www.theremino.com/blog/gamma-spectrometry/linearizations
https://www.theremino.com/blog/gamma-spectrometry/identification
per usarlo senza hardware si puo’ usare alcuni files audio disponibili qui :
https://www.theremino.com/blog/gamma-spectrometry/audio-files
naturalmente ogni contributo è ben accetto , stiamo sviluppando questo progetto con molti appassionati e professionisti a livello internazionale ,chiunque vuole partecipare ci farebbe molto piacere.
Happy Gamma spectrometry , Alessio.
I’m interested on your described Theremino_PmtAdapter. Where and when is this device available?
Thanks
Roland
We will not build the adapter because we are a “non profit” organization but you can call Alessio that will compose some kits for the friends.
Some test versions of the PMT adapter are working in my laboratory with outstanding performances ( voltage from 550 to 1100, good pulse shaping, good stability, noise 200uV ! )
But unfortunately there are problems that we must correct before to release a reproducible version.
1) the current consumption is too high ( 90 mA at 1100 Volt )
2) the high voltage transistor is difficult to find, so we are trying to substitute it with a mosfet (maybe a BSP300 – we will test it as soon as available)
3) in some situations (output short circuit) the circuit shuts down and the power must be removed to restart it
So, please, consider the:
https://www.theremino.com/files/PMT_Adapter.zip
https://www.theremino.com/files/PmtAdapter_FixedFreq_6.png
only as a good starting point…
I think that we can conclude experimentations in some weeks, for now you can call Alessio ( ik5pwr-AT-inwind.it ) and reserve one of the first kits.
bye
Livio
You can see our last version M2 (M2 means: the second version with the mosfet BSP300) in the following files:
Schematics: https://www.theremino.com/files/Alim_FixedFreq_M2.png
LTSpice simulation: https://www.theremino.com/files/Alim_FixedFreq_M2.asc
In order to use LTSpice with our circuits you must download our libraries and follow the instructions at the and of this page:
Italian: https://www.theremino.com/downloads/uncategorized
English: https://www.theremino.com/en/downloads/uncategorized
bye
Livio
Appena provato Theremino MCA 3.6.
Finora nessun problema rilevato. Il linealizzatore ha perfettamente messo in riga anche un tubo che mi ha sempre creato problemi.
Complimenti e buon lavoro.
Antonio
Grazie del commento! Sapere che il linearizzatore funziona bene ci fa davvero molto felici.
In molti ci avevano sconsigliato di usare questo metodo, sostenendo che equalizzare punti precisi, come il PRA, fosse meglio…
Theremino PMT adapter is ready for first February week.
There are three options :
first one Only bare PCB
Second Complete kit (PCB and components)
Third PMT adapter ready to use with USB audio sound card modified for easy connect to PC
if anyone are interest please contact me at alessio.giusti@meteolink.it
Nel kit completo i componenti smd sono gia montati o da montare?
Grazie
Fiorenzo
Il kit è composto da Circuito stampato e componenti (SMD e tradizionali) tutti da montare
I am interested in the BGO and PMT used to obtain thee signals. Do you have any data and information on the sensor and hardware.
Is the theremino performing an A/D signal anaylsis from the PMT?
About spectrometry sensors and hardware you can read the following pages:
https://www.theremino.com/blog/gamma-spectrometry (this page)
https://www.theremino.com/downloads/radioactivity (the download page)
https://www.theremino.com/video-and-images
And to download the ThereminoMCA and ThereminoGeiger from here:
https://www.theremino.com/downloads/radioactivity
https://www.theremino.com/wp-content/uploads/2012/11/ThereminoMCA_V4.5.zip
https://www.theremino.com/wp-content/uploads/2012/11/Theremino_Geiger_V4.6.zip
In the downloaded files you will find many useful documentation files in the “DOC” folders.
Mainly the files:
“PmtAdapters_ENG.pdf”
“ThereminoMCA_Help_ENG.pdf”
After downloading the software you can also test it “without any hardware” and also explore the documentation files using the application menu.
About the ADC
Yes, we use a 16-bit ADC, much better than the usual MCA hardware ADC
The audio ADC are internally oversampled and provide more than 100dB of dynamic. So they do not require the “Sliding scale” methods needed from the hardware MCA, because the steps (and thus the “bins”) are already very narrow.
In addition, with our software the usual costly zero ADC adjustments and the “zero-pole” compensations are not necessary, making the whole system simple and inexpensive.
Can I use a not stabilized power supply?
Can I use a negative power supply?
Why do not use a microcontroller A/D converter to read the PMT signal?